29/09/2011

Introduction to GIS - the QGIS way


Pengenalan kepada GIS - cara QGIS

Kementerian Perumahan dan Kerajaan Tempatan (KPKT) iaitu Kementerian saya telah meminta saya memberi ceramah mengenai pengenalan kepada GIS untuk pegawai-pegawi IT Kementerian pada bulan depan. Ini adalah kerana walaupun mereka tahu pasal GIS, akan tetapi tidak tahu GIS secara terperinci dan cara ianya diguna dalam pemetaan dan analisis. Saya telah diberi sokongan oleh pihak pengurusan dan telah pun siap slideshow berkenaan dimana pandai-pandai saya telah tumpukan kepada QGIS :-D. Kalau berminat, fail PDF boleh dimuat turun disini

Introduction to GIS - the QGIS way

The Ministry of Housing and Local Government (MHLG), that is, my ministry has requested me to give a talk on the introduction to GIS to the ministry's IT officers next month. This is because whilst they are aware of GIS, they are not familiar about ways it is used for mapping and analysis. My management has given approval and the slideshow has already been completed but shrewdly presented towards QGIS in mind :-D. If you are interested, the PDF file can be downloaded here.

23/09/2011

The monitoring of landuse development by Quantum GIS


Pemantuan pembangunan gunatanah melalui Quantum GIS

Akhirnya, kertas saya siap! Analisis GIS adalah usaha bersama Fadzlan dan saya yang kami akui tidak dapat kami buat seorang. Melihat kembali, ianya tidak sukar untuk dilaksana cuma kami masih mentah mengenai subjek SQL operators walhal kadangkala tanda-tanda jawapan menonjol di depan mata. Amat memalukan. Saya fikir mungkin perkara seperti ini biasa bagi peneoka... ataupun kerana takut buat silap? :-D. Kertas itu telah dihantar ke MaCGDI untuk Bulletin Geospatial Sektor Awam kepunyaan Kementerian Sumber Asli dan Alam Sekitar  (NRE) dan tidak dapat pula ke jabatan sendiri kerana jernal kami  mempunyai tema tertentu mengikut isu. Saya harap ianya akan diterima sebagaimana dilulus kertas unggul saya dahulu. Minat ke untuk membaca kertas saya (Saya tidak kenal diri sebagai pakar!)? Kalau ya, kertas   PDF boleh dimuat turun sini Bagi saya, batasan tertinggi bukan GIS tetapi menyiapkan analisis terlebih dahulu atas kertas terutama menyiapkan matrik lalu menterjemahkan ke dalam klausa SQL tetapi selepas menjalani kesemua proses sebanyak 3 kali, baru saja mula saya faham.

The monitoring of landuse development by Quantum GIS

At last, this paper of mine is finally complete! GIS analysis was a joint effort which both Fadzlan and myself admit we could not have been done alone. Looking back, it was not difficult to do but because we are still new on the subject of SQL operators, we were groping in the dark for a while and the hints were sometimes starring us in the face. How embaressing. I guess that is something normal for pioneers ... or was it fear of making mistakes? :-D. Well, I just submitted it to the Ministry of National  Resource and Envronment (NRE) MaCGDI's Geospatial Public Sector Bulletin but could not to my own department's Journal because ours has a specific theme per issue. I'm hoping it will be accepted as  was my first paper sometime ago. Are you interested in reading this paper of mine (I don't qualify myself as an expert!)? If so, the PDF paper can be downloaded here. For me, the biggest hurdle was not the GIS but getting the analysis done on paper especially completing the matrix then translating that into SQL clause but after I made myself do the whole process on QGIS about 3 times did I get the hang of it.

    15/09/2011

    * Editing many wrong spellings in the attribute table


    Menyunting ejaan salah yang banyak dalam attribute table

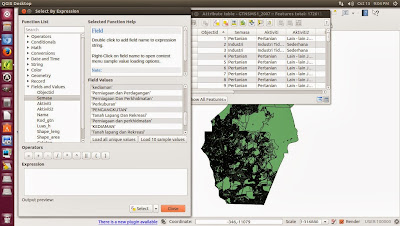
    Kesilapan ejaan dalam kerja pemetaan GIS akibat human error atau teknikal error yang dimasukkan dalam attribute table adalah biasa tetapi apa terjadi apabila bilangan ejaan yang perlu dipindaan masuk ketahap ratusan? Tentu ada cara lain dari pembetulan ejaan. Kalau dengan spreadsheet caranya adalah mudah kerana ejaan yang diperbetulkan boleh direplikasi dengan tarikan penghujung sel ke bawah atau ke atas kolum berkaitan tetapi keistimewaan teknik ini tidak dapat dilakukan dalam attribute table GIS :-(. Tapi jangan putus asa! Gunakan otak, gunakan kreativti isyallah, ada jalan. Selepas mengodek-godek QGIS, jalannya terbuka. Caranya dalam QGIS adalah menggunakan aplikasi Query Builder untuk menapis senarai ejaan yang perlu dipinda seterusnya menggunakan Field Calculator untuk mengajar QGIS ejaan baru untuk menggantikan ejaan asal tak kira akibat kesilapan manusia mau pun masalah teknikal. Beratus-ratus ejaan telah saya dapat pinda dalam hanya sejam yang saya fikir akan mengambil masa berpuluh-puluh jam atau pun hari untuk menyelesaikan masalah ejaan tersebut. Pakej Query Builder-Field Calculator truly fantastic kalau kita kira masa yang dapat dijmatkan dan kerja pembetulan boleh diringkaskan apabila operator "OR" digunakan keatas value-value sama yang mempunyai ejaan salah. Jangan lupa bahawa pembetulan ejaan hanya akan berlaku selepas carian SQL dilaksanakan terlebih dahulu.
    Editing many wrong spellings in the attribute table

    Spelling errors in GIS mapping due to human or technical error entered into the attribute table is normal but what happens when the number of spellings that require amendment enters into the hundreds? Obviously, there must be a way to solve this problem. On spreadsheets, the methodology is easy because correcting spelling error can be replicated by pulling the end of the cell up or down the relevant column but this method could not be carried out in the GIS attribute table. But don't lose hope! Use your brains, use your creativity, God willing, there is a way. After tinkering with QGIS, the answer was made known. In QGIS, the technique involves use of the Field Calculator to 'teach' QGIS the new spelling to replace the older spelling irrespective of how mistake was caused. Hundreds of spelling mistakes did I manage to amend within an hour that would have taken hours or days to do the normal way. The Query Builder-Field Calculator is truly fantastic when considering the amount of time saved and it is possible to join common values with spelling error using the "OR" operator to simplify the process. Just remember that spelling correction only works after a SQL search was made or else no correction was directed.

    14/09/2011

    * Fear of making mistakes


    Fear of making mistakes

    I stopped and looked back at the progress my partner and me did in our research of QGIS more as a GIS analytical tool rather than a mapping tool and we congratulated ourself for much progress made in the recent months. The blog entries at QGIS MALAYSIA were on a daily basis as we pounded our minds together whenever we saw a potential area where we could use QGIS for GIS analysis in particularly in the field of town and country planning. I now felt that the use of QGIS as an analytical tool was very simple than before and my partner who had used proprietary GIS more than me said he was surprised GIS users are not optimizing this GIS, free and user-friendly and since he now has been exposed to the QGIS-GRASS package, finds it hard to beat with the exception of QGIS being slow where big files are concerned and unfortunately this is the case with town planning! We hope this issue can be fully addressed when Version 2 comes around.

    It was then that I asked what was it that was the stumbling block to our success? We sat quiet for a while and my partner concluded that it was "fear" or specifically fear of making mistakes, fear of being retributed if we fail miserably because we had now become the QGIS pioneers for the department and pioneers only know too well, that failure would be miserably painful. If we failed, it would also be embarrassing and we were sure to be made a bigger laughing stock since the majority of GIS users do not see eye to eye with us. This mental barrier made us reluctant to want to try out existing buttons on the QGIS screen especially the ones we had not clicked on before so we never got to know if those buttons could have been the solution to our problems eventhough they were staring right in front of us. This mental barrier blocked our creativity and stubbed our innovative spark that it was not until after a few blind tries here and there did we realize we had let ourselves down all this while by this negativism. Because we had tried in areas we though would never work but instead did succeed, it has changed our attitude and I can confidently say we both are now in better mental shape than before, more receptive to any form of ideas, suggestions and ever willing to give them a try or two, never mind the result can be null, at least we will know we have tried and not theorize that the answer may or may not be in that direction. My fear of being questioned now has changed and I greet probing questions on QGIS with the anticipation of switching on the light in a dark room. I now appreciate it when people say that success comes through many failures ... but it's not all that bad because each failure makes us stronger.

    13/09/2011

    Tips from QGIS User Guide


    Tips dari Panduan Pengguna QGIS

    Mengikut ramai penjual telefon mobil yang telah saya bersembang, kata mereka ramai pembeli tidak suka merujuk pada Panduan Pengguna setelah membeli produk masing-masing walhal banyak persoalan yang dibangkitkan mengenai produk tersebut boleh dijawab dengan mudah jika pengguna membaca Panduan Pengguna setelah membeli produk. Mendengar nasihat ini, terus saya mengambil initiatif untuk membaca sekali lagi Panduan Pengguna Quantum GIS Versi 1.5 yang telah saya hardcopy-kan tetapi kali ini secara terperinci.  Antara perkara-perkara menarik yang saya terjumpa adalah termasuk:

    • Definition of GIS
      Setelah beberapa tahun ni, saya sendiri tak sangka :-( GIS is not a software but "a collection of software that allows you to create, vizualize, query and analyse geospatial data" (Ref: Chapter 1.1 Introduction to GIS)

    • Indexing improves performance
      Hebatnya perkara ni yang dinamakan spatial indexing. "A spatial indexing will improve the speed of both zooming and panning". (Ref:3.1.2 Improving Performance) Here, QGIS uses a .qix extension. But while a user may be reluctant to use .qix extensions , importing the file into GRASS also creates spatial indexing and improves performance but further to that data topology is cleansed.

    • Benefits of using PostGIS"
      The benefits of PostGIS are the spatial indexing, filtering and query capabilities it provides. Using PostGIS, vector functions such as select and identify work more accurately than with OGR layers in QGIS. (Ref: 3.2 PostGIS Layers)

    • Improving Performance
      "You can improve the drawing performance of PostgrSQL layers by ensuring that a spatial index exists on each layer in the database" (Ref:3.2.5 Improving Performance)

    • Snapping tolerance
      " Your results may vary but something on the order of 300ft should be fine at a scale of 1:10,000 should be a reasonable setting (Ref: 3.5.1 Setting the Snapping Tolerance and Search Radius) This works out at 0.00001 and I am left wondering if the relative size of a study area has a direct effect to what tolerance is "reasonable" e.g. in a country with a huge span of area like USA may feel the need for 0.00001 whereas a small country like Malaysia the need for 0.0001 is "reasonable" enough.
    • Interoperable
      Interoperable (ref: 5.1 What is OGC Data?) This seems to be the coin (a) phrase of the future where data sharing is concerned and with that in mind, whatever the Open Geospatial Consortium (OGC) recommends for the open source community looks like the direction of the future.

      Tips from QGIS User Guide


      From many mobile telephone retailers whom I talked to, they say that many buyers do not like to refer to the User Manual once the respective product was purchased but in fact many queries could be answered had users read the User Manual after buying the product. Hearing this advice, I took the initiative to read again this time in detail, the Quantum GIS Versi 1.5 user Guide having hardcopied it.  Among the points I found include:

      • Definition of GIS
        After many years, I did not realize :-( GIS is not software but "a collection of software that allows you to create, vizualize, query and analyse geospatial data" (Ref: Chapter 1.1 Introduction to GIS)

      • Indexing improves performance
        This thing called spatial indexing is terrific. "A spatial indexing will improve the speed of both zooming and panning". (Ref:3.1.2 Improving Performance) Here, QGIS uses a .qix extension. But while a user may be reluctant to use .qix extensions , importing the file into GRASS also creates spatial indexing and improves performance but further to that data topology is cleansed.

      • Benefits of using PostGIS"
        The benefits of PostGIS are the spatial indexing, filtering and query capabilities it provides. Using PostGIS, vector functions such as select and identify work more accurately than with OGR layers in QGIS. (Ref: 3.2 PostGIS Layers)

      • Improving Performance
        "You can improve the drawing performance of PostgrSQL layers by ensuring that a spatial index exists on each layer in the database" (Ref:3.2.5 Improving Performance)

      • Snapping tolerance
        " Your results may vary but something on the order of 300ft should be fine at a scale of 1:10,000 should be a reasonable setting (Ref: 3.5.1 Setting the Snapping Tolerance and Search Radius) This works out at 0.00001 and I am left wondering if the relative size of a study area has a direct effect to what tolerance is "reasonable" e.g. in a country with a huge span of area like USA may feel the need for 0.00001 whereas a small country like Malaysia the need for 0.0001 is "reasonable" enough.

      • Interoperable
        Interoperable (ref: 5.1 What is OGC Data?) This seems to be the coin (a) phrase of the future where data sharing is concerned and with that in mind, whatever the Open Geospatial Consortium (OGC) recommends for the open source community looks like the direction of the future.

    12/09/2011

    Huh? Diffcult to convert projection?


    Huh? Susah ke nak convert projection?

    Sebelum ni, bila sebut saja pasal projection conversion, orang akan kata tindakan ini akan menyebabkan ketetapan peta banyak lari dan prosidur untuk buat conversion adalah banyak dan leceh tetapi apabila saya buat percubaan untuk convert projection dengan menggunakan modul QGIS dibawah Data Management Tools, saya tidak nampak pulak isu-isu yang dibangkitkan dan saya rasa sedikit bingung nak appreciate apa yang telah mereka utarakan. Mungkin adanya possibility peta lari sedikit tetapi pada pandangan saya 'acceptable'. Biasanya apa jua conversion sama ada dari .mov kepada .mp3, dari .doc kepada .odt dll dari terdapat sedikit conversion error yang ramai orang fikir adalah akibat kelemahan perisian terlibat dan kalau ada perasaan prejudis pulak, akan meraka salahkan perisian yang tidak mereka biasa guna contohnya kalau si Polan sudah biasa dengan .doc, apabila conversion error terjadi kepada .odt, mereka cepat akan salahkan OpenOffice.org tetapi kalau kita tanya yang datang dari latarbelakang IT, mereka akan mengesahkan ini adalah perkara norma atau karakteristik data conversion bukan kelemahan perisian. Balik ke cerita asal, pengguna cuma perlu pilih lapisan yang ingin diconvert projectionnya dan dibawah Data Management Tools, select "export to new projection" seterusnya pilih projection yang diingini dibawah Output Spatial Reference misalnya Google Mercator. Sebab selalu malas, saya lebih suka ambil jalan shortcut dan pilih Google Mercator pada ruang kotak dibawah dan bukan mencari Google Mercator secara sistematik. Yang penting, output yang dihasilkan adalah seperti apa yang diingini. OK lah, ini bermakna lapisan asal boleh kita buang. It is that simple!

    Huh? Difficult to convert projection?

    Before this, when the subject of projection conversion was mentioned, people said this would cause  map inaccuracy to run wild and conversion procedure would be lengthy and messy but when I tried to convert projection using the QGIS module under Data Management Tools, I did not see any issues at all and I felt fuzzy trying to appreciate what they had said all the while. Maybe some accuracy is lost but for me 'acceptable'.  In fact, whatever conversion is made e.g. from .mov to .mp3, from .doc to .odt etc. some conversion error occurs which many thought the culprit was due to OpenOffice.org but if you ask people from the IT background, they will confirm such things are normal or characteristics of data conversion not a weakness of the software. Back to my original story, the user just needs to select the preferred layer and under Data management Tools, select "export to new projection" then select the preferred projection under Output Spatial Reference e.g. Google Mercator. Because I am usually lazy, I like to take shorcuts and select Google Mercator in the box below, not search for Google Mercator systematically. What is important is the output is what was wanted. OK , this means the original layer can now be removed. It is that simple!

    09/09/2011

    Use coordinate convertor to amend original GPS data


    Pakai coordinate convertor untuk ubahsuai data asal GPS

    Nampaknya terdapat agensi-agensi yang telah mengambil iniatif untuk membangunkan pangkalan data bagi aset masing-masing dengan menentukan kordinat GPS dengan hasrat untuk memindahkan data tersebut ke dalam bentuk data geospatial. Ini adalah tindakan proaktif tapi masalahnya penyimpanan data geospatial GIS biasanya dalam format decimal degree, oleh itu, perlulah pengguna membuat pindaan kepada data asal yang disimpan dalam kordinat long-lat. Cara yang palih mudah bagi saya untuk menghasilkan data baru ni adalah (sekali lagi ;-D ) meminta bantuan Internet. Dengan kemudahan Google search, ditiap "coordinate converter" seterusnya dipaparkan beberapa pautan yang menyediakan converter tersebut. Pilihan saya adalah boulter.com yang saya berpendapat adalah mudah, senang dan efektif...harap-harap laman ini akan terus berkekalan :-)  Caranya amat simpul...kordinat long dan lat asal dimasukkan dalam kotak convertor terus dibuat sedikit pindaan seperti contoh yang diberi kat bawah kotak tersebut kemudian diklik "convert and map". Sekiranya semua OK, hasilnya akan ditag pada ruang peta sebelah kanan. Kordinat long dan lat kemudian disalinkan kepada spreadsheet. Senangnya!

    Use coordinate convertor to amend original GPS data

    It looks like many agencies have already taken the initiative to develop a database of their respective assets by getting the GPS coordinates with the hope of eventually transferring that data in the form of a proper geospatial data. This is proactive thinking but the problem is that GPS data is usually kept in the  decimal degree format as such the user has to amend the original long-lat coordinates. The simpliest way I know to obtain the new data (here again ;-D) is to get the help of the Internet. With Google search, typing "coordinate convertor",  a list of links shows where to convert. My choice is boulter.com which I feel is simple, easy and effective...hopefully this site will be here forever :-) The method is simple...the original long and lat coordinate is placed in the converter box then slightly amended as shown in the example below the box followed by clicking "convert and map". If everything went OK, the result will be tagged in the adjacent map on the right. The long and lat coordinate can later be copied to a spreadsheet. That easy!

    08/09/2011

    Retrieving 3-D easier than thought!


    Paparan 3-D lebih senang difikir!

    Penggunaan lapisan 3-D sesuai digunakan dalam perancangan bandar contohnya pihak berkuasa tempatan boleh menentukan sama ada pemandangan line of sight dari sesuatu vista akan dihalang oleh mana-mana cadangan pembangunan fizikal seperti blok busines atau apartmen yang tinggi. Dalam hal ini, teringat saya dasar kawalan perancangan di Johor Bahru dimana sebarang pembangunan fizikal dari tebing Selat Tebrau hingga ke Kompleks Tun Abdul Razak (TAR) tidak dibenar menghalang pemandangan line of sight dari tingkat tertinggi Kompleks TAR. Walaupun buat masakini, penggunaan aplikasi seperti ini masih belum digiatmaju oleh pihak-pihak tertentu, saya terus mencuba kebolehan QGIS untuk membangunkan lapisan 3-D dengan bantuan modul GRASS "nviz" yang merupakan alat untuk menyediakan vizualisation dan animation bagi menentukan sendiri sama ada langkah-langkahnya adalah susah ke tidak berasaskan pengalaman saya yang tidak biasa dengan aplikasi 3-D. Buat kali ini, saya hanya cuba menyediakan lapisan 3-D dan pada mulanya, saya menjangka kerja ni akan sukar dijalankan tetapi to my surprise, penyediaan 3D dengan nviz lebih senang dari yang disangka khasnya bagi saya yang datang dari aliran Arts. Yang saya amat tertarik dengan nviz adalah apabila imej 3-d yang telah saya janakan dapat diexaggerate-kan rupabentuk ketinggian bukit dan diubah angle pemandangan mengikut citarasa pengguna. Kesimpulannya, nviz is really cool stuff!

    Retrieving 3-D easier than thought!

    The use of 3D layers is useful in town planning  e.g. local authorities can determine whether the line of sight from a certain vista is obstructed by any propose physical development like business block or high rise apartment. In this aspect, I am reminded of the planning control policy at Johor Bahru where no physical development from the edge of the Tebrau Straits to the Tun Abdul Razak complex (TAR) should obstruct the line of sight from the highest floor of the TAR complex. Although the use of this application is currently not popularly used by respective parties, I went ahead and gave QGIS a try at creating a 3D layer with the help of the GRASS module "nviz" which represents the tool to prepare visualization and animation and to determine for myself if it is indeed difficult based on my barren knowledge of 3D application. This time around, I tried to create a 3D layer and thought it would be difficult  but to my surprise it was easier than expected considering I'm from the Arts stream. What attracted me about nviz was that the 3d image can be the form of a highland can be exaggerated and tilted to any angle. Conclusion, nviz is really cool stuff!

    07/09/2011

    Line Labelling without line


    Menanda garis tanpa garisan

    Satu hari akan tiba masanya untuk pengguna GIS melabelkan attribute GIS sama ada point, line atau polygon untuk memperkayaan data dan memudahkan pengguna mengorientasikan diri pada peta berkaitan. Penggunaan line merupakan ciri yang paling mudah berbanding dengan point kerana label senang di-align tanpa memikir darjah rotation yang perlu ditetapkan cuma clik point asal, tarik cursor dan tanda point penghujung mengikut alignment yang di ingini seterusnya masukkan id dan nama attribute. Akhir sekali padamkan line tersebut. Apa nak susah-susah!

    Line labelling without line

    One day will come when the GIS user will label GIS attribute whether it is point, line or plogon to enrich data dan make it convenient for the user to orientate himself to the relevant plan. The use of line labelling is the simpliest way as against point labelling because it is easy to align without having to think how to rotate the required degree all is need is to click the preferred point, pull the cursor and mark the point according to the alignment needed followed by the id and name attribute. Lastly remove the line label. It is not that difficult!


    06/09/2011

    Calculate area by QGIS


    FOR UPDATE JUMP HERE

    Mengitung keluasan dengan QGIS

    Field calculator merupakan alat untuk menghitungkan keluasan polygon secara automatik dimana expression adalah $area. Hasil pengihtungan menggunakan filed calculator bukan dalam unit hectare dan adalah dalam unit sq.metre hanya sebab dikonfigur pengukurannya dalam metre dan bukan feet. Ini bermakna sekiranya pengguna ingin mendapatkan hasil dalam unit hectare, perlu dilakukan tindakan tambahan untuk convert unit sq.metre ke hectare. Formulanya adalah 1/10,000 bagi unit hectare. Ini akan ubahkan hasil calculation asal secara automatik dari sq.metre ke hectare. Kami buat semakan Google search dan dapati ramai yang tidak tahu cara untuk calculate area by QGIS, oleh itu, mereka menyangka QGIS tidak boleh menghasilkan output tersebut tetapi sebenarnya QGIS boleh dan hanya memerlukan simple conversion mathematics. Kesimpulannya jangan percaya semua yang dinyatakan dalam Internet, perlulah pengguna buat sedikit trial & error.

    Calculate area by QGIS

    The Field calculator represents the tool for automatically calculating the area of a polygon where the expression is $area. The result of the calculation using the Field Calculator is not in unit hectare but in unit s. metre only because I had set the measurement to be in metres and not feet. This means that if the user needs to calculate in hectare unit, there is a need to do additional calculation to convert the sq. metre to hectare. The formula is 1/10,000 per hectare unit. This is automatically convert the result of the original calculation from sg. metre to hectare. We did a check on Google search and found out that not many know how to calculate are using QGIS and as such they presume QGIS cannot produce the needed output while it actually can and only requires simple mathematics conversion. The conclusion is do not believe everything you read on the Internet, there is a need to do some trial and error.

    02/09/2011

    Snapping tolerance: Bit-by-bit, a little goes a long way


    Snapping tolerance: Sikit-sikit jadi bukit

    Tidak dinafikan bahawa penyediaan peta dapat dilakukan tanpa banyak songeh mengenai QGIS default setting tetapi apabila isu petepatan dihargai, penggunaan snapping option amat berguna. Tetapi soalnya sejauhmana harus ditetapkan unit tolerance? Sini tiadanya pendirian cuma panduan yang boleh  diberi adalah lebih halus unit tolerance, lebih tepatnya akan hasil kerja digitizing. Saya dimaklumkan tolerance yang diamalkan oleh ArcGIS adalah 0.001 dan ada pandangan bahawa range sesuai adalah antara 0.001-0.005 ataupun sekil 1/1,000-1/5,000. Manual QGIS pula menyatakan bagi altitude 300', tolerance yang "reasonably setting" adalah 0.00001 atau 1/10,000 (Apa maksudnya, saya masih berfikir). Argument yang diberi adalah apabila tolerance 0.005 diguna, mana-mana gap tidak dapat dilihat secara kasar (bukan bermakna ianya tidak ada). Cubalah buat sendiri dan setelah beberapa cubaan antara 0.001 and 0.005, saya kira lebih kurang selesa dengan tolerance 0.001 tapi kalau saja nak tunjuk kesan snapping, akan saya pilih 0.01. Aspek kedua snapping option merupakan setting unit tolerance by "map unit" atau "pixel" dimana pilihan pixel ada kaitan dengan saiz monitor yang diguna. Skrin monitor yang mempunyai resolusi tinggi mungkin tidak akan nampak banyak perbezaan snapping tolerance jika unit pixel diguna, maka, bagi kes seperti ini, pilihan map unit merupakan opsyen yang lebih berkesan. Tapi kawan, jika kerja snapping terkena pada node atau vertex yang salah, bolehkah unsnapping dibuat? Tarik node kesana kesini dan kedua-dua vertex tak akan berpisah. Unclick snapping option juga gagal. Jangan panik...solutionnya adalah menu/edit/undo! Tu la...tak cuba tak tahu!

    Snapping tolerance: Bit-by-bit, a little goes a long way

    There is no denying that the preparation of a plan can be carried out with QGIS with much fuss using the default setting but when the issue of accuracy arises, the use of the snapping option is most useful. But the question of how accurate should the unit of tolerance be? There are no fast rules here just that the more bigger the unit tolerance, the more accurate it will digitizing be. I was told that the tolerance used by ArcGIS is 0.001 and there is an opinion that the suitable range should be between 0.001-0.005 or 1/1,000-1/5,000. The QGIS manual stated at at altitude of 300', a "reasonably setting" tolerance is 0.0001 or 1/10,000 (Whatever that means? I am still wondering) The argument is that when a 0.005 tolerance is used, there is no gap (cannot be visually seen ). I tried it myself and after a few tries between 0.001 and 0.005, I am quite comfortable with 0.001 but to visually it snap, I would choose 0.01. The second aspect of the snapping option is the unit tolerance setting by "map unit" or "pixel unit" whereby the pixel option is relative to the size of the monitor used. The screen monitor with a higher resolution may not show much difference between snapping tolerance if pixel unit is used so in this case, the map unit option is more effective. But friend, if snapping work accidentally hit a wrong node or vertex, can it be undone? Pull the node to the left or right and nothing happens. Unclick the snapping option also fails. Don't panic! The solution is menu/edit/undo. See you never know if you don't try!

    01/09/2011

    * Evolutionary path to the best of both worlds


    Evolutionary path to the best of both worlds

    My first exposure to GIS many years ago was ArcView when I embarked on a Masters of Science course in GIS and Remote Sensing, something an Arts student would think twice unless he knew sooner or later he could not get away from GIS at work. I found this ESRI product presented itself in a logical and user-friendly way so I was not too worried. Thankfully I managed to get through even though I had to learn a bit of Avenue programming which was unavoidable as my thesis touched on the development of an expert system. Returning back to work, I ended up a manager where much GIS executive task was delegated and I lost touch with hands-on GIS. As time went by, I got fed up regularly maintaining my Windows computer against virus, malware, defragging and scandisk so I decided to tinker with the increasingly popular Ubuntu operating system. I was so impressed by Ubuntu that I eventually became a convert. As this hobby of mine took me deeper into Open Sourceland, I ventured into GIS territory and got attracted to a Q logo with an arrow in it, like a fall-in-love sign yet this time falling in love with a GIS. Since things are free in open source, what the heck, I gave it a try and I soon "fell-in-love" with Quantum GIS. The turning point came when I volunteered a management request to look into open source GIS as the Prime Minister's Department was promoting open source notably OpenOffice.org. About that time, the stable QGIS version was soon released. I found QGIS handles very much like ArcView so you can understand why I was immediately taken by it, no need to relearn the ropes! From my experience, I also knew modules are not cheap so it was double-joy to know that there was a variety of modules to pluck from the Internet, courtesy of the open source community. Testing QGIS here and there, I found that while it has a problem when large files are involved, it was stable and served its purpose well in the field of town planning. There are less ArcGIS users and more Mapinfo users at my department. After the QGIS training, the Mapinfo users said QGIS was indeed user-friendly. I  come to realize now why there have been many comments on the Internet stating QGIS is user-friendly. Yes, it's user-friendliness was what I liked about QGIS and I was quite happy to be a QGIS user, to me, it proved to be a good mapping tool as well as good for general analysis. But when more types of GIS task were given to me, I found QGIS to be limited in certain fields, particularly when I needed more control over the default input settings which my task required. It was then that I decided to venture into GRASS modules after noting that both are open source pals. The earlier training gave insight on how to establish mapsets and import GRASS modules which I always found confusing but now I must say it is much easier that I thought. There are over 400 GRASS modules to choose from and topology cleaning further attracted me to venture deeper into GRASS modules.  I admit I was a bit lazy of wanting to do the read-up and just plunge straight into the GRASS commands, so mine was a case of trial and error and of trying which tool is right for the job and which tool I should use next and so forth just to get the job done. All in all, I concluded QGIS shines as a slick and user-friendly GIS while GRASS modules represents itself as a powerful analytical brother so as a package, QGIS-GRASS is a force to be reckon with. Still, one should initially give QGIS modules a try and only switch over to GRASS modules when the QGIS equivalent does not deliver, if any. For example, Roma104 mentioned that the road graph plugin in QGIS is "ten steps shorter and less cryptic...".  QGIS and GRASS make very good partners and should solve many a GIS analytical problem since their modules are many and range from raster, vector, database and display just to name a few. As such, I am still researching on the many GRASS modules has to offer and will definitely not need all, merely, those that fit my specialization: town planning but a multi-disciplinary field nevertheless. Although I can prove that QGIS can be at par with proprietary GIS, there is still reluctance among locals unfamiliar with QGIS (people have heard of GIS but randomly asking if they have heard of QGIS maybe asking too much)to use a free GIS because of a common mindset that they must be inferior to proprietary GIS. All I can say is beggars should not be be choosers.